Test System
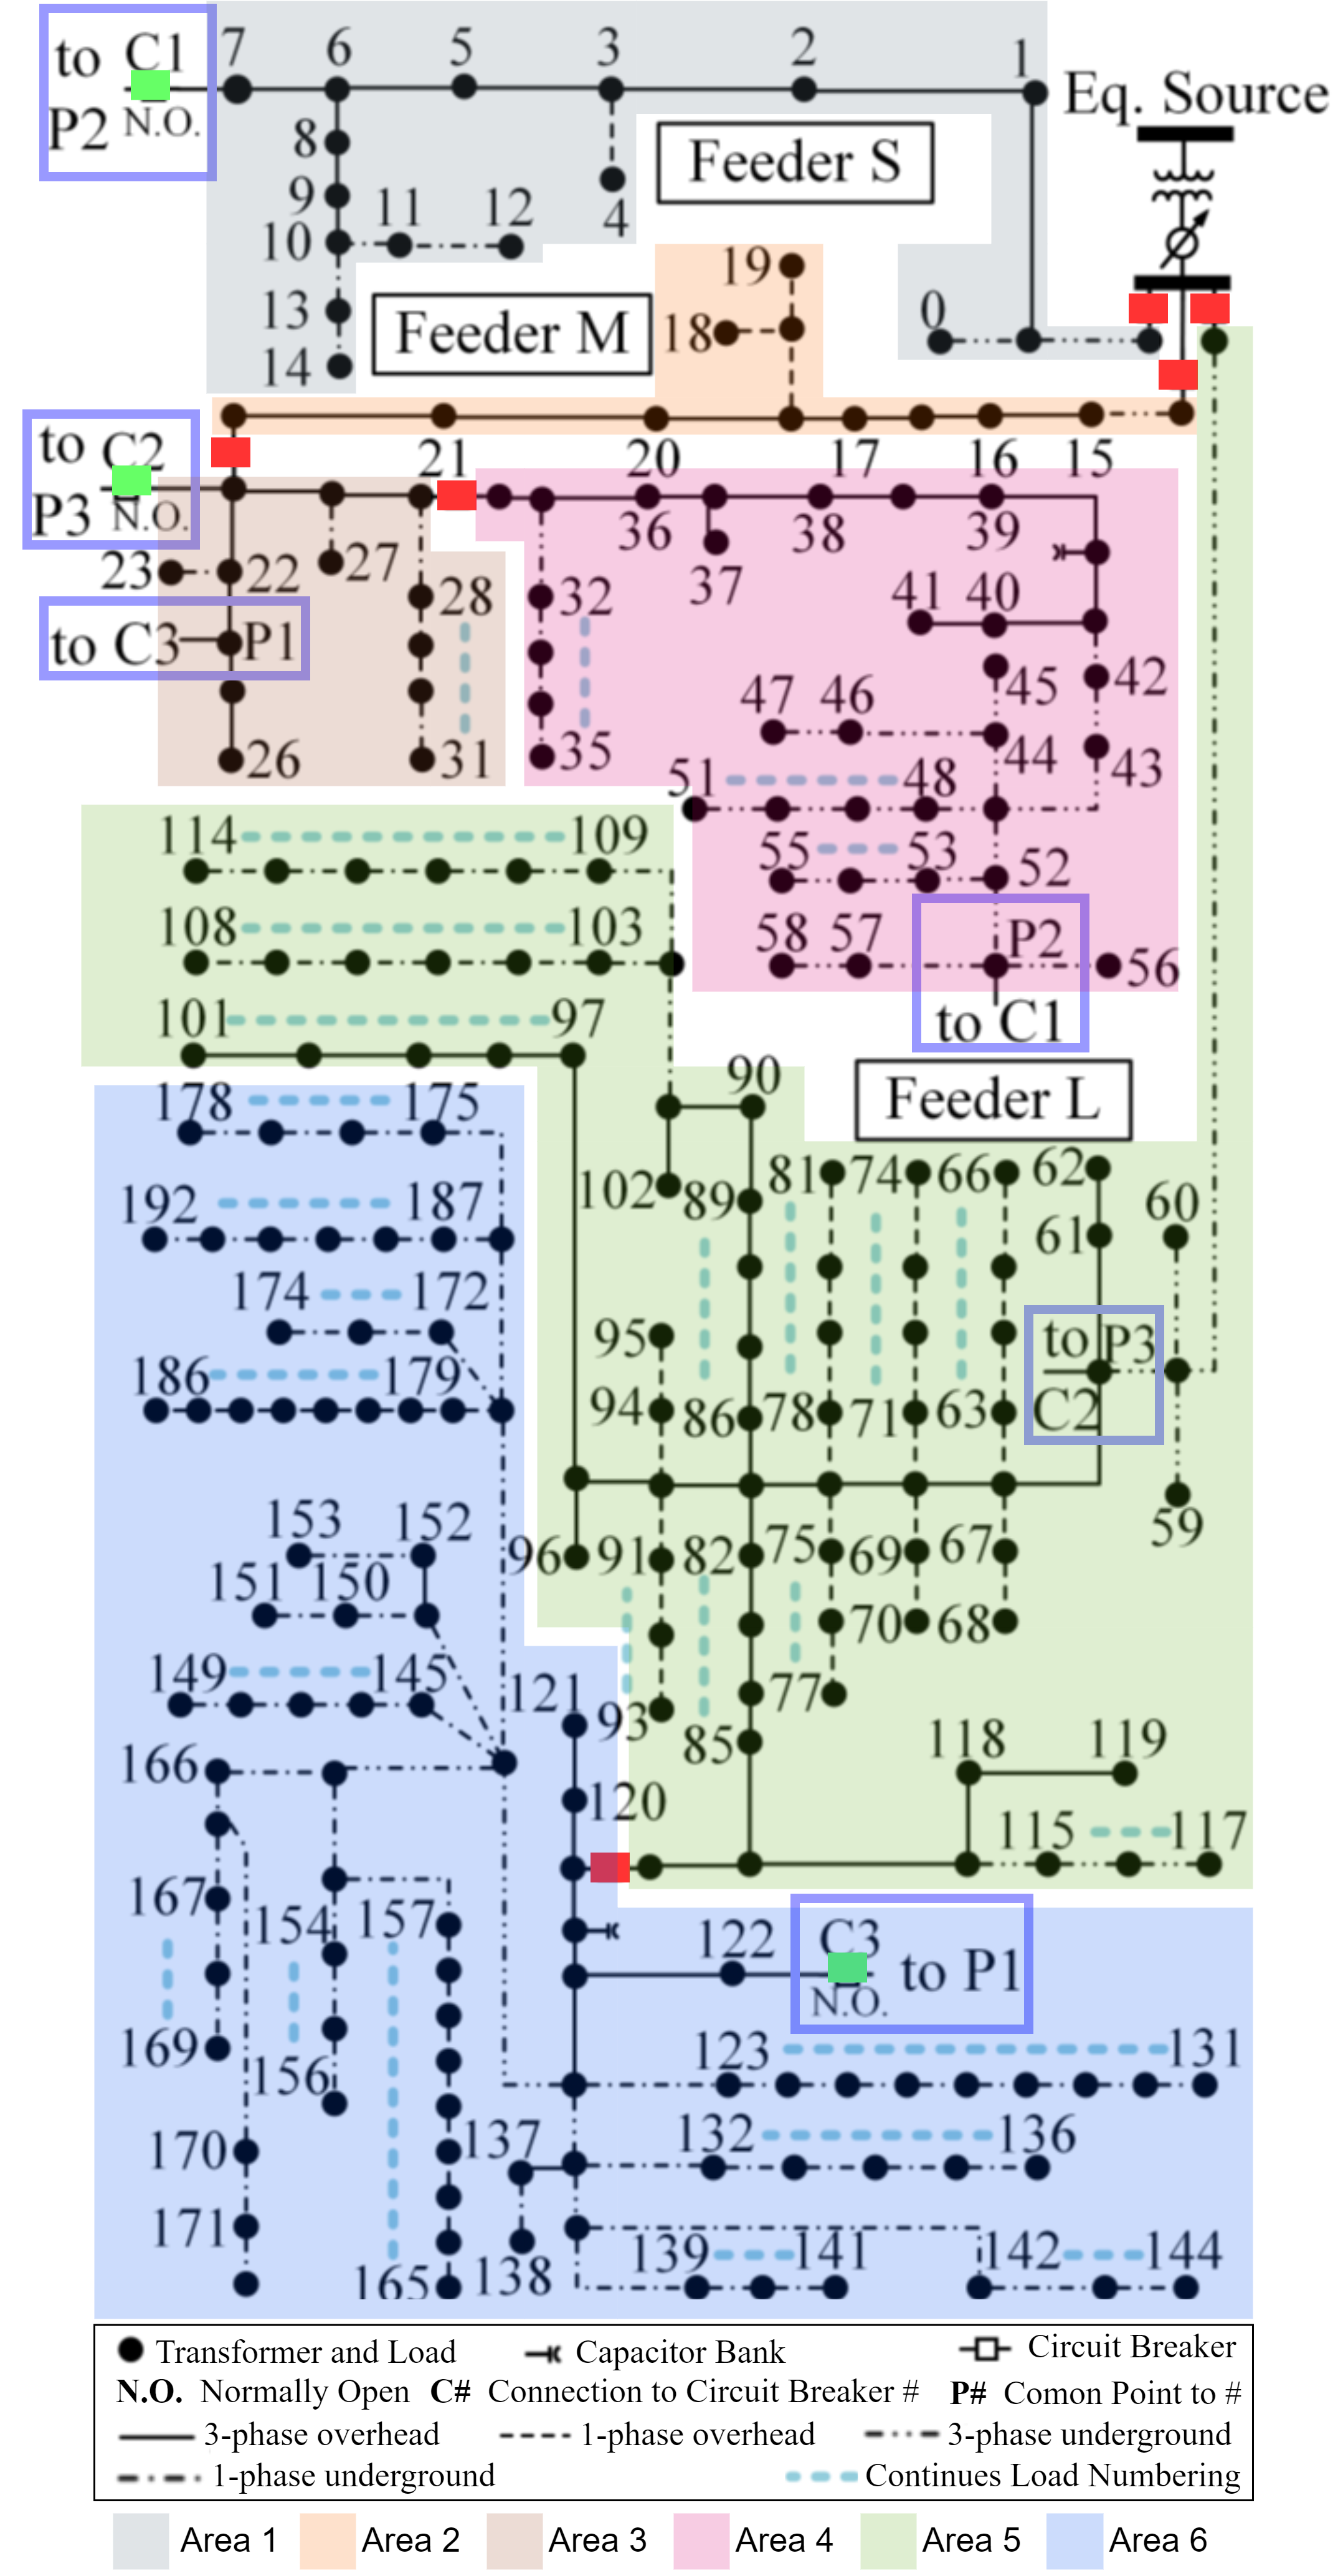
To evaluate the proposed methodology, we applied it to a distribution network to test its accuracy. Specifically, we utilized the publicly available Midwest 240-Node test distribution system, which is modeled after an actual distribution network located in the Midwest region of the United States [2, 3]. This system consists of 240 primary network nodes and spans 23 miles of primary feeder lines. A visual depiction of the system can be found in Figure One line diagram of the test system. Adapted from fernando2021iowa_testcase.. We also leveraged a full year’s worth of smart meter measurements at the node level. Appliance-level load data with minute-level resolution was synthesized for this period using the approach detailed in [4], with the original data derived from hourly nodal smart meter readings. The synthesized load data achieved a mean absolute percentage error of 2.58% when compared to the hourly smart meter data. Both the minute-resolution load data and the GridLAB-D [5] model of the Midwest 240-Node test system are publicly available [6].
The Midwest 240-Node test distribution system is a radial network composed of three feeders—S, M, and L—denoting small, medium, and large sizes. Its accessibility, the availability of load profiles from real smart meter data, and the inclusion of multiple feeders with switch-delimited areas make it ideal for testing the proposed algorithm. Additionally, the system links each load bus to its respective households, which makes it well-suited for assessing the DLT-based FLISR’s effectiveness in restoring customer connections. Due to the state estimation (SE) algorithm’s inability to handle split-phase transformers, the loads were assigned to the primary side of these transformers. A SE algorithm and a power network model reduction algorithm have been utilized but are not the focus.
Fernando B. dos Reis, Reinaldo Tonkoski, Bishnu Bhattarai, and Timothy M. Hansen. A real-world test distribution system with appliance-level load data for demand response and transactive energy studies. IEEE Access, 9:149506–149519, 2021. URL: https://doi.org/10.1109/ACCESS.2021.3120923, doi:10.1109/ACCESS.2021.3120923.
Z. Wang. Iowa Distribution Test Systems. 2019. URL: http://wzy.ece.iastate.edu/Testsystem.html (visited on 2/18/2020).
Fankun Bu, Yuxuan Yuan, Zhaoyu Wang, Kaveh Dehghanpour, and Anne Kimber. A time-series distribution test system based on real utility data. In 2019 North American Power Symposium (NAPS), volume, 1–6. 2019. doi:10.1109/NAPS46351.2019.8999982.
Fernando B. dos Reis, Reinaldo Tonkoski, and Timothy Hansen. Synthetic residential load models for smart city energy management simulations. IET Smart Grid, February 2020. URL: https://digital-library.theiet.org/content/journals/10.1049/iet-stg.2019.0296, doi:10.1049/iet-stg.2019.0296.
Pacific Northwest National Laboratory (PNNL). GridLAB-D. 2022. URL: https://www.gridlabd.org/.
Fernando B. dos Reis. A Real-World Test Distribution System with Appliance-Level Load Data for Demand Response and Transactive Energy Studies. 2021. doi:10.17632/d57wxwgt4w.1. URL: https://data.mendeley.com/datasets/d57wxwgt4w/1 (visited on ), doi:http://dx.doi.org/10.17632/d57wxwgt4w.1.